rs_align_disp_coordsets_demo
Demonstration workflow for display of several datasets and their consensus
Workflow:
- data files are read
- data files are aligned (coordinates each stimulus are placed in corresponding rows)
- a consensus is calculated by rotating each dataset so that the coordinates are as closely matched as possible
- the component datasets
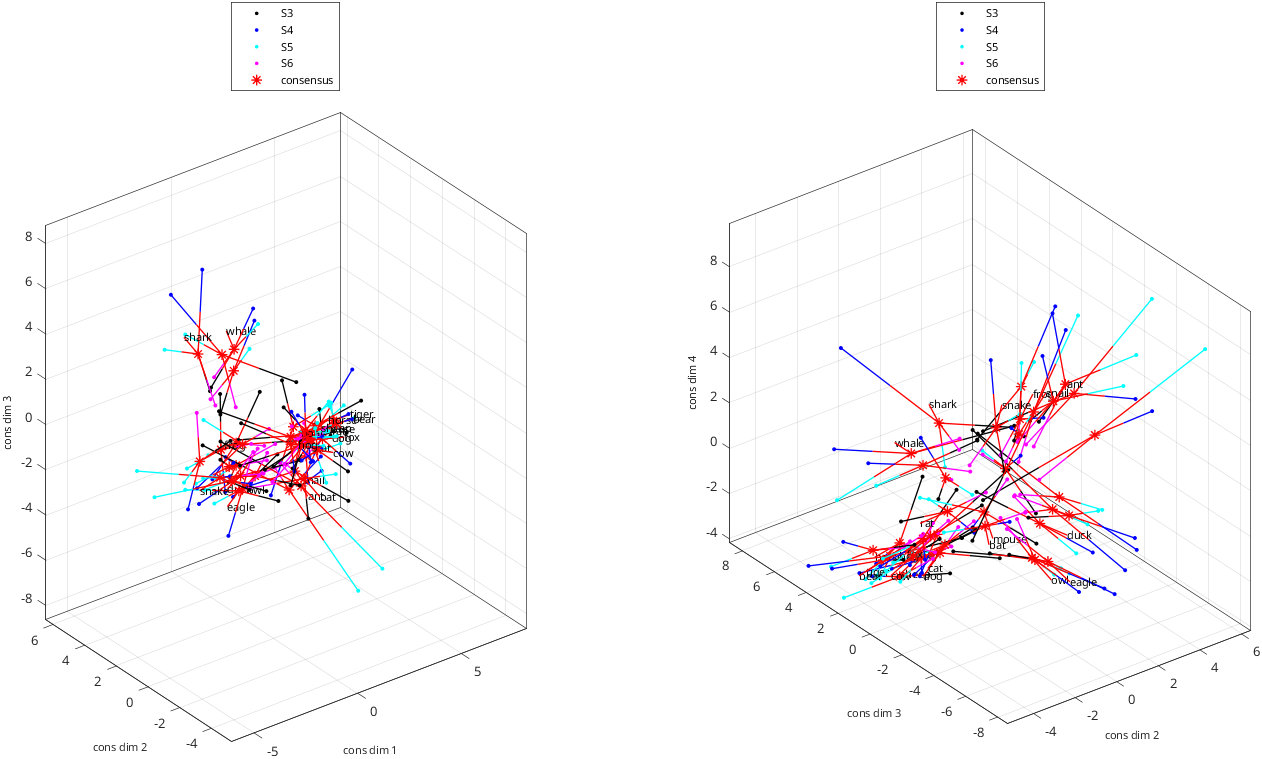
- the original data, the components, and the consensus are displayed
Plot options illustrated:
- choice of dimension and coordinates to plot
- several plots into same figure
- selective datapoint labelling with custom callouts
- custom arrangement of subplots
- rotation of raw data coordinates into a consensus
- combining consensus and individual datasets on same plot
- custom data point symbols
- custom axis labels
- custom labeling of datasets based on subject ID
- connecting corresponding points between plots
- selection of data points to label based on length of stimulus name
See also: rs_get_coordsets, rs_align_coordsets, rs_knit_coordsets, rs_concat_coordsets, rs_disp_coordsets
%section to force btc defaults, even if rs_aux_defaults.mat has been created or modified
=struct;
={};
Read four datasets
Datasets are from four subjects of Waraich and Victor, J. Neurosci. 2024
={};
=;
=auxs_force;
=; %input type 1=data, if_auto=1: non-interactive, if_log=1 to log
=nsets;Read the coordinates of each dataset with rs_get_coordsets
[]=;
=;
=data_read.sas{1}.nstims; %number of stimuli; assume same in all sets
=5; %max length of a stimulus label
=[];
Output:
 entering set  1 of  4:
primary dataset 1 is experimental data
 37 different stimulus types found in  data file ./samples/animals/image_coords_S3
 37 different stimulus types found in setup file [unused]
 37 of  37 labels found
coordinate sets with  1 to  7 dimensions read.

 entering set  2 of  4:
primary dataset 2 is experimental data
 37 different stimulus types found in  data file ./samples/animals/image_coords_S4
 37 different stimulus types found in setup file [unused]
 37 of  37 labels found
coordinate sets with  1 to  7 dimensions read.

 entering set  3 of  4:
primary dataset 3 is experimental data
 37 different stimulus types found in  data file ./samples/animals/image_coords_S5
 37 different stimulus types found in setup file [unused]
 37 of  37 labels found
coordinate sets with  1 to  7 dimensions read.

 entering set  4 of  4:
primary dataset 4 is experimental data
 37 different stimulus types found in  data file ./samples/animals/image_coords_S6
 37 different stimulus types found in setup file [unused]
 37 of  37 labels found
coordinate sets with  1 to  7 dimensions read.

datasets selected:
 set  1: dim range [  1   7] label: samples/animals/image_S3
 set  2: dim range [  1   7] label: samples/animals/image_S4
 set  3: dim range [  1   7] label: samples/animals/image_S5
 set  4: dim range [  1   7] label: samples/animals/image_S6
##### rs_warning: cannot find stimulus coordinates, so cannot identify rays
##### rs_warning: cannot find stimulus coordinates, so cannot identify rays
##### rs_warning: cannot find stimulus coordinates, so cannot identify rays
##### rs_warning: cannot find stimulus coordinates, so cannot identify rays
Display the original data
=[]; %make two 3-d plots, one with dimensions 1,2,3, one with dimensions 2,3,4
=;%
=figure; %open a figure for the plots
=auxs_force.opts_disp;
=hfig;
=[];
='raw data';
=4; %display coordinates for the 4-dimensional model
=; %display coordinates in groups of 3
='list'; %we explictly list the coordinate groups
=coord_groups;
=subj_ids; %label each plot with subject ID
='list'; %we provide a list for the labels for each data point
=data_label_list; %labels for each data point
=0.3; %labels are slightly removed from each data point
='set_colors'; %use the color assigned to each dataset for the callout lines
='-'; %dashed callout lines
='North'; %legend location
=;
=;
each call to rs_disp_coordsets will plot data from one subject, both coordinate groups
=haxes;
=iset; %subject selection
aux_out_raw{iset}=; %create the plot
end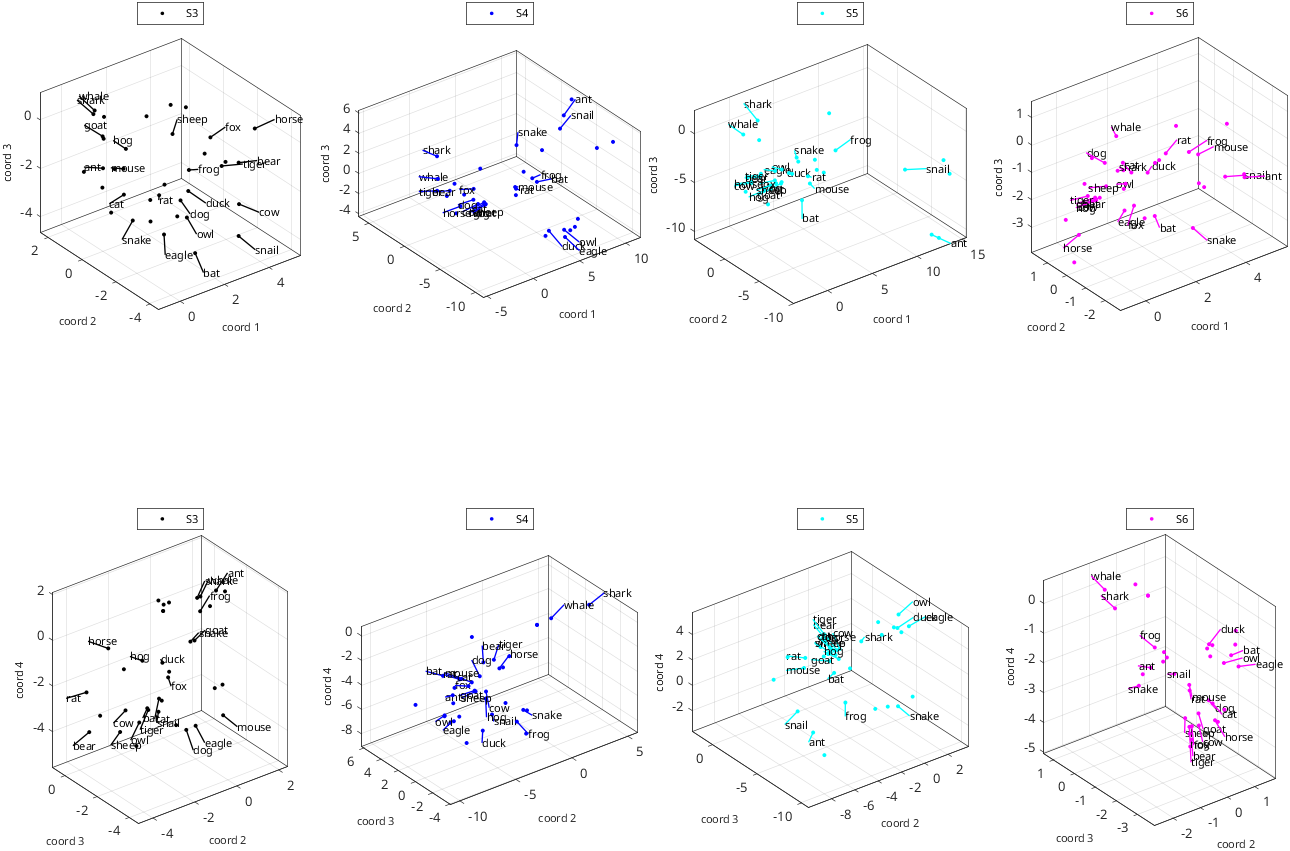
align data, rotate data into a consensus, and use each component, aligned to consensus, for further plotting
=auxs_force.opts_align;
[]=;
=auxs_force.opts_knit;
[]=;
=[]; %stimulus order may have changed, so need to re-identify the stimuli
Output:
proceeding with alignment of   4 datasets, paradigm type animals, stimuli must be present in 1
alignments attempted with  4 datasets
 set   1: stimuli:  37, type       data, label samples/animals/image_S3
 set   2: stimuli:  37, type       data, label samples/animals/image_S4
 set   3: stimuli:  37, type       data, label samples/animals/image_S5
 set   4: stimuli:  37, type       data, label samples/animals/image_S6
 unique typenames:  37
 typenames present in at least  1 datasets:  37
if_type_coords_remake=1 (determined from metadata)
##### rs_warning: cannot find stimulus coordinates, so cannot identify rays
##### rs_warning: cannot find stimulus coordinates, so cannot identify rays
##### rs_warning: cannot find stimulus coordinates, so cannot identify rays
##### rs_warning: cannot find stimulus coordinates, so cannot identify rays
 number of stimuli missing in dataset   1:    0
 number of stimuli missing in dataset   2:    0
 number of stimuli missing in dataset   3:    0
 number of stimuli missing in dataset   4:    0
data table
    37    37    37    37
    37    37    37    37
    37    37    37    37
    37    37    37    37

sa_pooled and data_align will be created.
NaN removal attempted with  4 datasets
 set   1: stimuli:  37, type       data, label samples/animals/image_S3
 set   2: stimuli:  37, type       data, label samples/animals/image_S4
 set   3: stimuli:  37, type       data, label samples/animals/image_S5
 set   4: stimuli:  37, type       data, label samples/animals/image_S6
 unique typenames:  37
proceeding with alignment of   4 datasets, paradigm type animals, stimuli must be present in 1
alignments attempted with  4 datasets
 set   1: stimuli:  37, type       data, label samples/animals/image_S3
 set   2: stimuli:  37, type       data, label samples/animals/image_S4
 set   3: stimuli:  37, type       data, label samples/animals/image_S5
 set   4: stimuli:  37, type       data, label samples/animals/image_S6
 unique typenames:  37
 typenames present in at least  1 datasets:  37
if_type_coords_remake=1 (determined from metadata)
##### rs_warning: cannot find stimulus coordinates, so cannot identify rays
##### rs_warning: cannot find stimulus coordinates, so cannot identify rays
##### rs_warning: cannot find stimulus coordinates, so cannot identify rays
##### rs_warning: cannot find stimulus coordinates, so cannot identify rays
knitting  37 stimuli across   4 datasets, dimensions   1  2  3  4  5  6  7
  allow reflection: 1, allow offset: 1, allow scale: 0, normalize scale: 0, rotate to pcs: 0
 calculations with allow_scale=0, if_normscale=0
 set  1: created shuffles for  37 stimuli
 set  2: created shuffles for  37 stimuli
 set  3: created shuffles for  37 stimuli
 set  4: created shuffles for  37 stimuli
 created  Procrustes consensus from dim  1 to dim  1 based on component datasets, iterations:    2, final total rms dev per coordinate:  2.50094
 created  Procrustes consensus from dim  2 to dim  2 based on component datasets, iterations:    8, final total rms dev per coordinate:  2.82280
 created  Procrustes consensus from dim  3 to dim  3 based on component datasets, iterations:   17, final total rms dev per coordinate:  2.93191
 created  Procrustes consensus from dim  4 to dim  4 based on component datasets, iterations:   11, final total rms dev per coordinate:  2.86859
 created  Procrustes consensus from dim  5 to dim  5 based on component datasets, iterations:   16, final total rms dev per coordinate:  2.88087
 created  Procrustes consensus from dim  6 to dim  6 based on component datasets, iterations:   23, final total rms dev per coordinate:  2.91432
 created  Procrustes consensus from dim  7 to dim  7 based on component datasets, iterations:   52, final total rms dev per coordinate:  2.92061
##### rs_warning: cannot find stimulus coordinates, so cannot identify rays
=opts_disp_raw; %many options match the raw plot
=; %new figure
=[];
=;
='consensus';
=[];
='cons dim';
=data_label_list_consensus;concatenate the component data and the consensus
=;opts_disp_cons.set_labels{nsets+1}='consensus';
='star_last';
opts_disp_cons.set_markers{nsets+1}='*';
='last';
=1.0;;