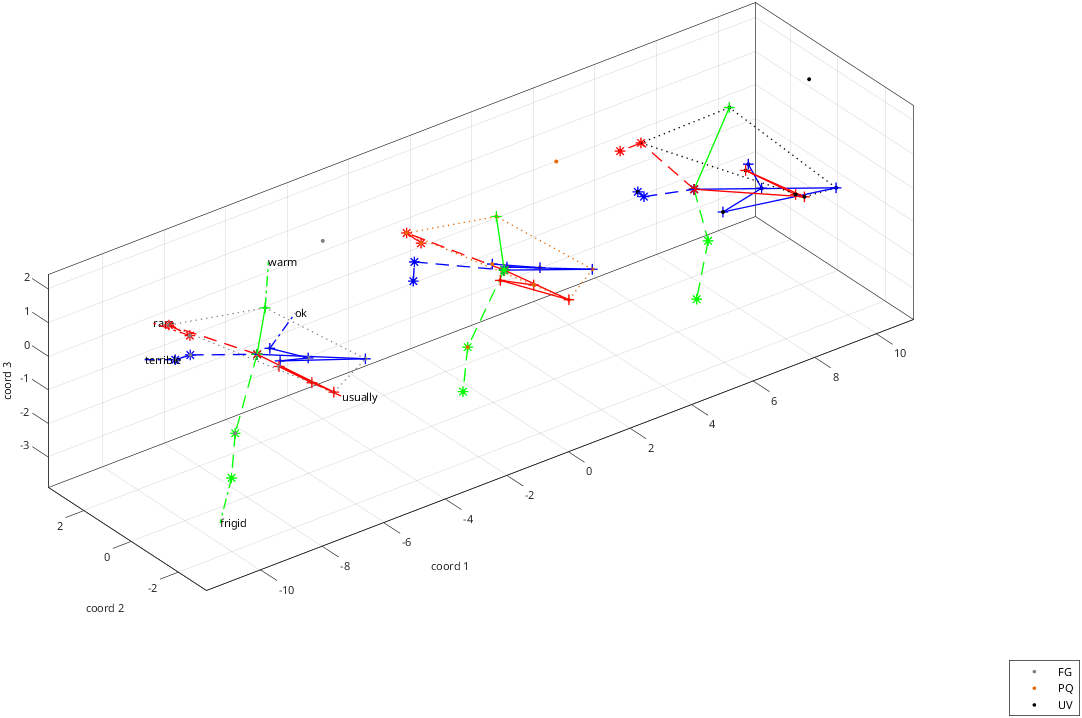
rs_disp_coordsets_demo_opposites
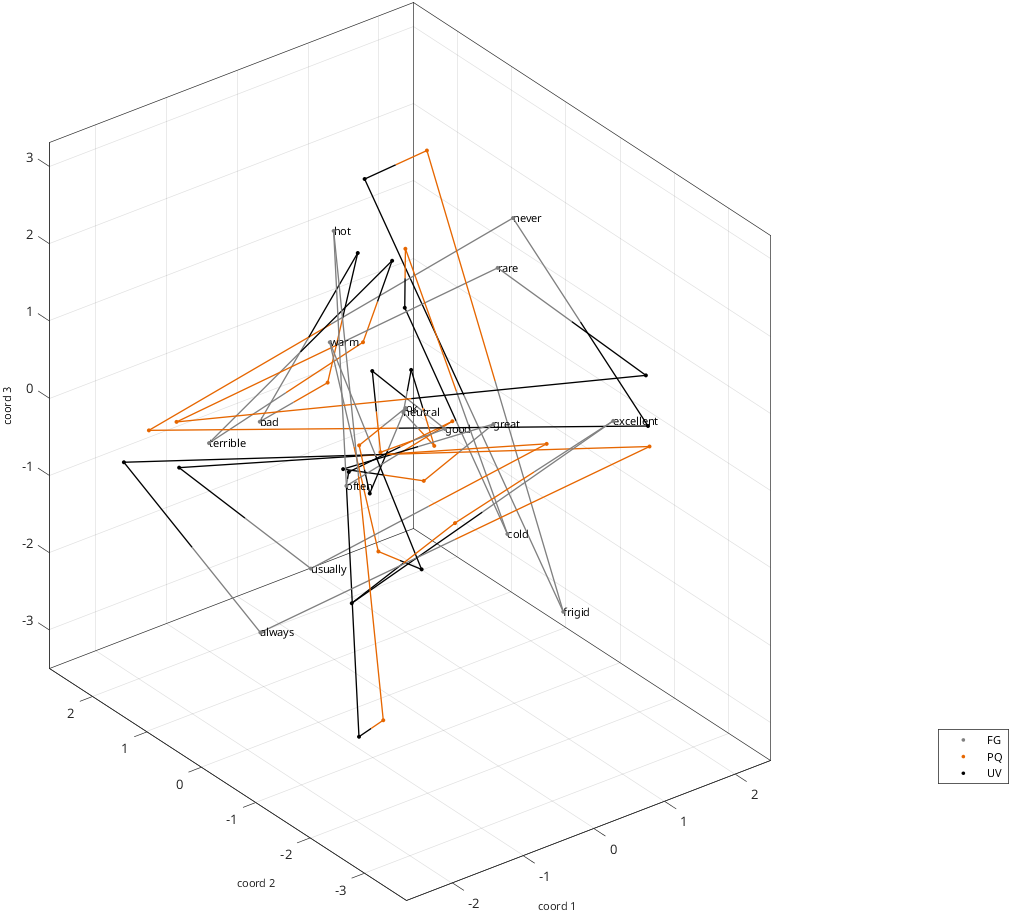
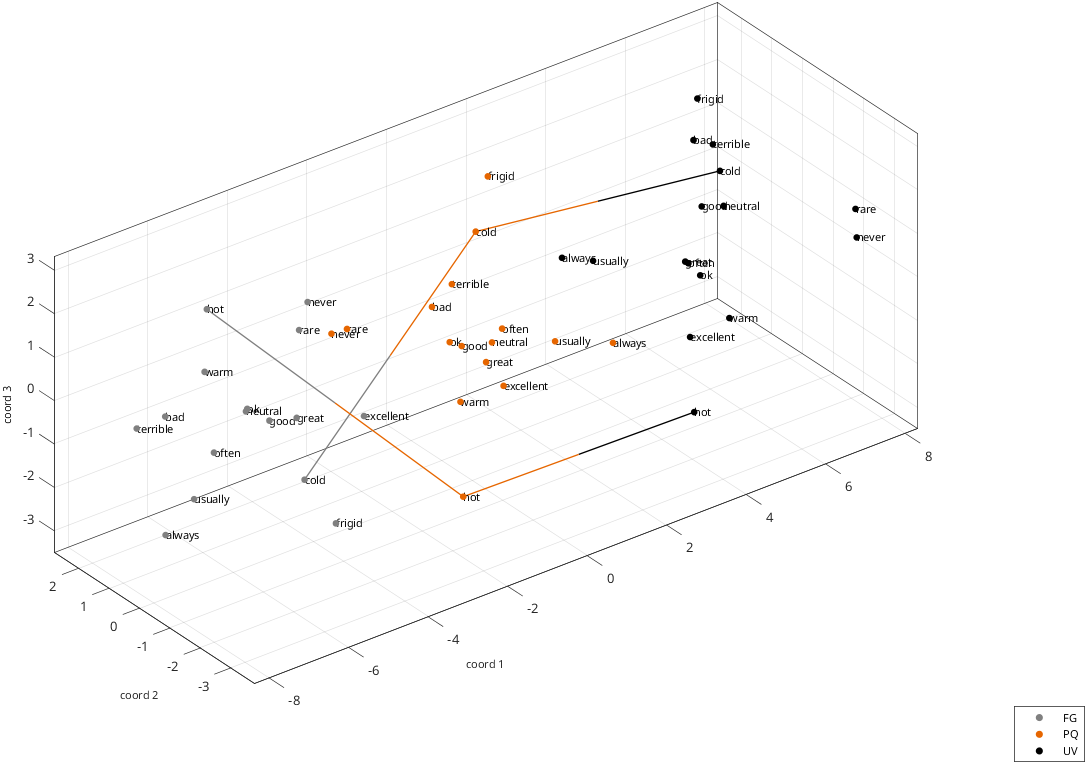
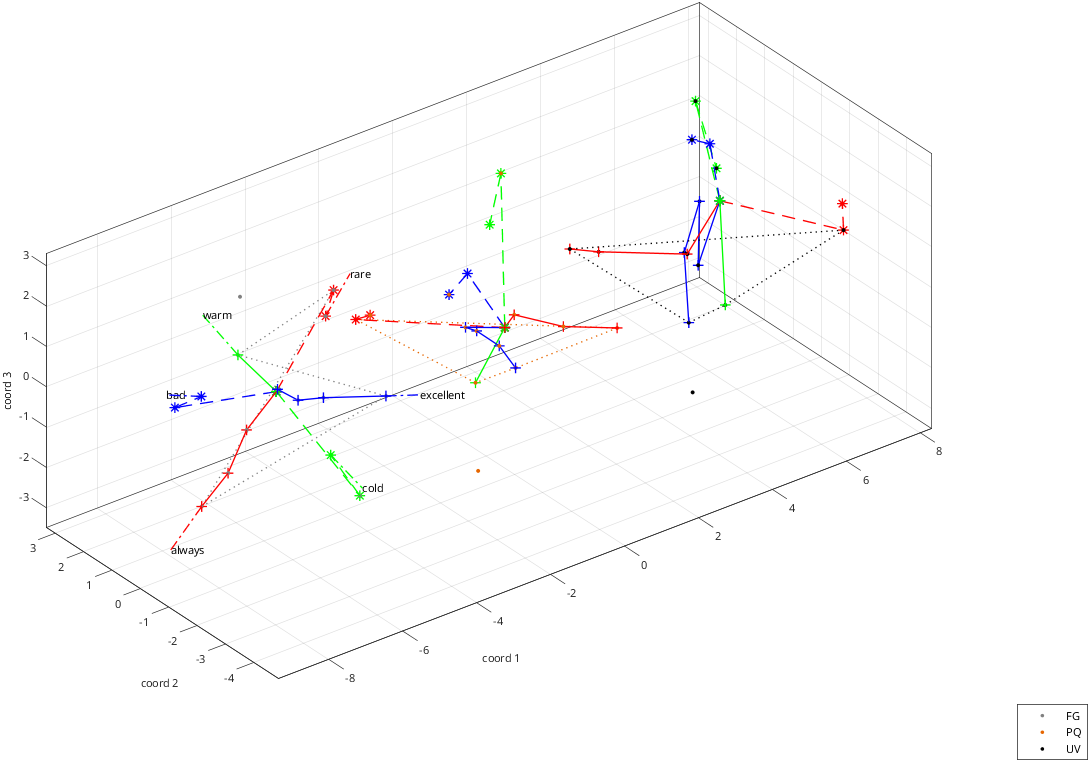
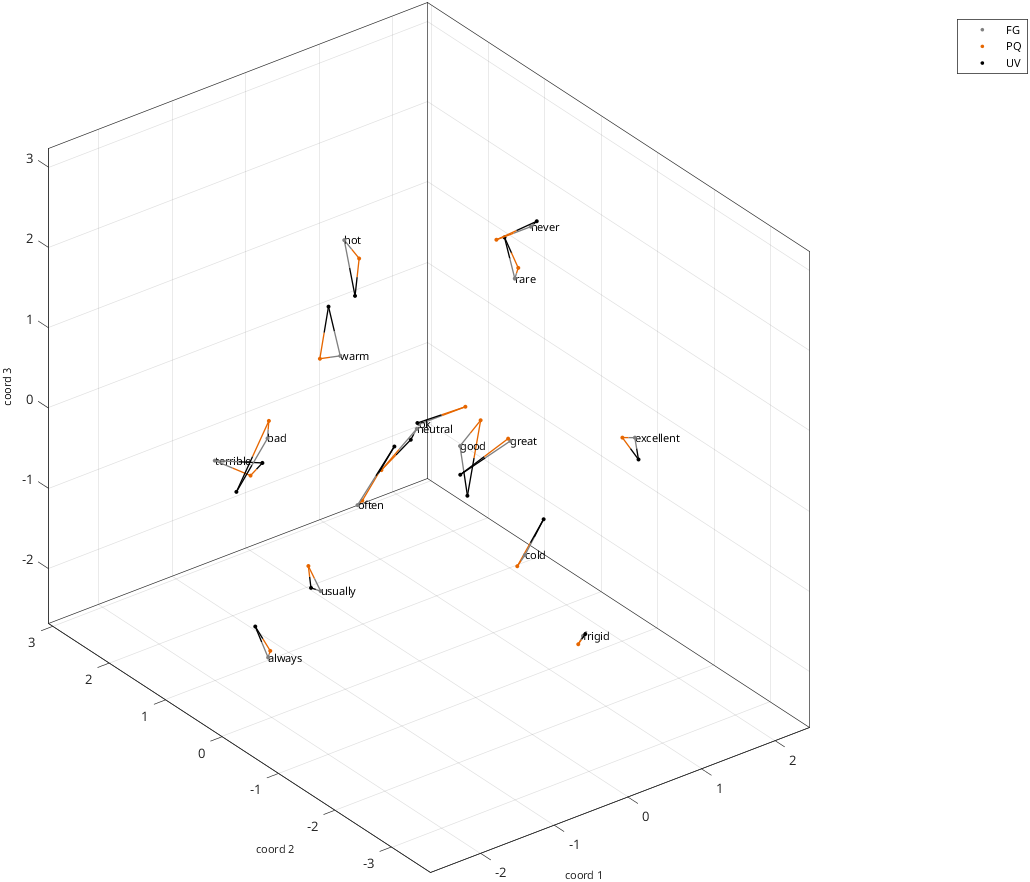
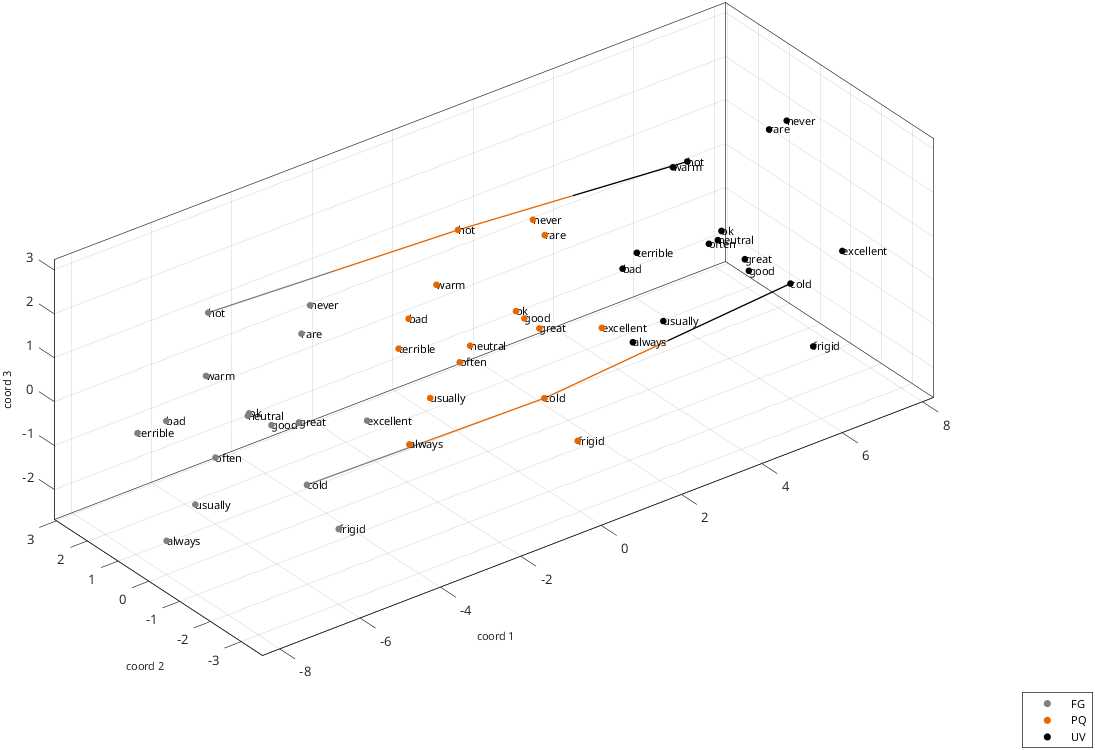
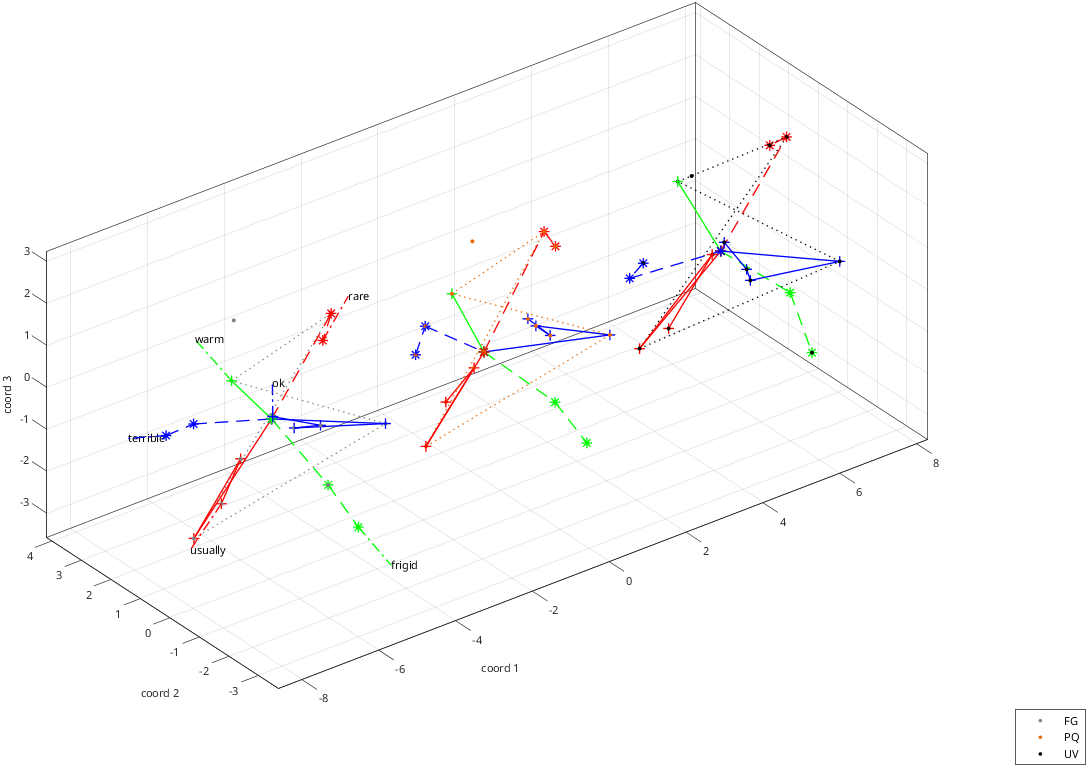
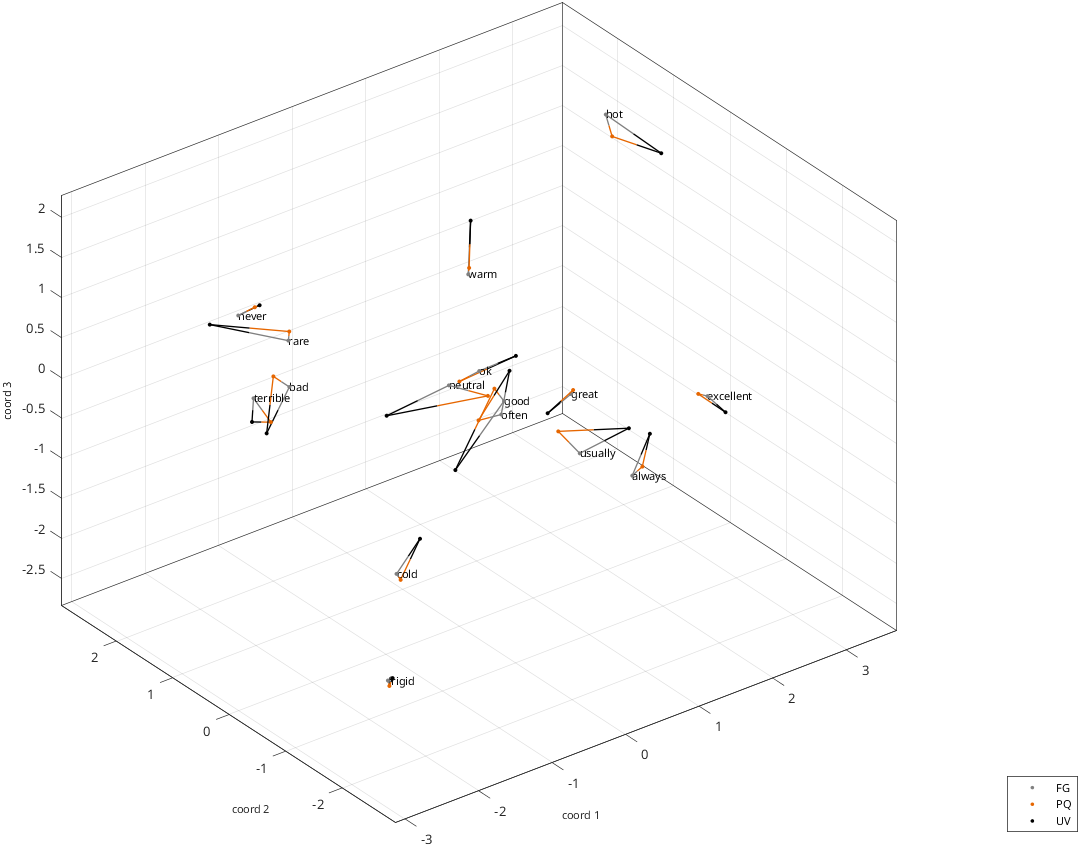
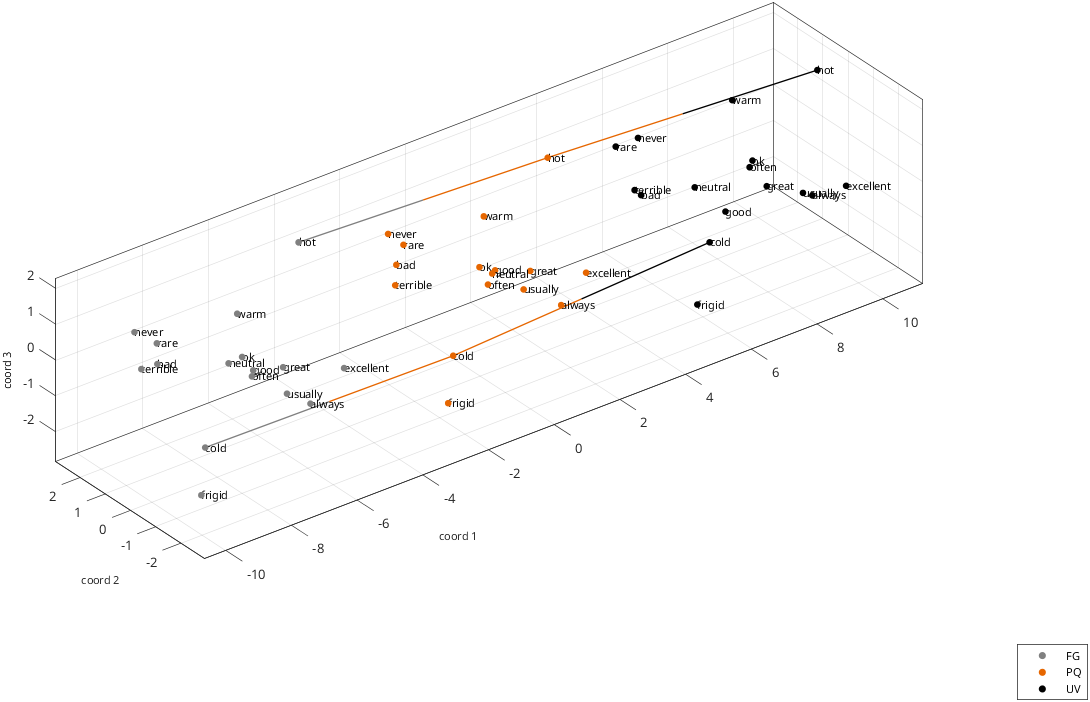
Display datasets in a structured domain (stimulus coordinates and rays)
Normally 'data_out', 'aux_out' and 'nfiles' are already in the workspace, having been created by rs_read_coorddata_demo_opposites. If they are not, that demo is run first, reading the three built-in coordinate files, so that this script can also be run standalone.
See also: rs_disp_coordsets, rs_read_coorddata_demo_opposites
=;
=struct;
={}; %custom colors for the datasetsOutput:
no data found; running rs_read_coorddata_demo_opposites
1-> read data files sequentially with rs_read_coorddata
2-> read several data files at once with rs_get_coordsets
3-> read several datasets created with quadratic form models with rs_get_coordsets
4-> read mix of data files and datasets created with quadratic form models with rs_get_coordsets
 16 different stimulus types found in  data file demos/opposites_coords_FG
 16 different stimulus types found in setup file [unused]
 16 of  16 labels found
coordinate sets with  1 to  3 dimensions read.
 16 different stimulus types found in  data file demos/opposites_coords_PQ
 16 different stimulus types found in setup file [unused]
 16 of  16 labels found
coordinate sets with  1 to  3 dimensions read.
 16 different stimulus types found in  data file demos/opposites_coords_UV
 16 different stimulus types found in setup file [unused]
 16 of  16 labels found
coordinate sets with  1 to  3 dimensions read.

data_out =

  <a href="matlab:helpPopup('struct')" style="font-weight:bold">struct</a> with fields:

      ds: {{1x3 cell}  {1x3 cell}  {1x3 cell}}
     sas: {[1x1 struct]  [1x1 struct]  [1x1 struct]}
    sets: {[1x1 struct]  [1x1 struct]  [1x1 struct]}

can now display with rs_disp_coordsets_demo_opposites
Enter dimension list (range: 2 to 3, default= 3):3
=aux_disp;
='all'; %connect datasets=aux_disp;
=16; %larger markers
='all'; %label all sets
='margin_amount'; %how to space between datasets
=1; %offset along coordinate 1
='chain'; %connect set 1 to 2, and 2 to 3
='list'; %label all sets=aux_disp;
='margin_amount'; %how to space between datasets
=1; %offset along coordinate 1
=1;
=0;
=0; %use coordinate values rather than typenames to color=aux_out{1}.rayss{1};knit by Procrustes
=struct;
=struct;
=opts_knit;
[]=; %align stimuli via Procrustes; stimuli will be reordered alphabetically
=aux_knit_out.rayss{1}; %stimuli will be reordered by knitting, so rays need to be recalculated
=aux_knit_out.components; %Output:
 number of stimuli missing in dataset   1:    0
 number of stimuli missing in dataset   2:    0
 number of stimuli missing in dataset   3:    0
data table
    16    16    16
    16    16    16
    16    16    16

sa_pooled and data_align will be created.
NaN removal attempted with  3 datasets
 set   1: stimuli:  16, type       data, label demos/opposites_FG
 set   2: stimuli:  16, type       data, label demos/opposites_PQ
 set   3: stimuli:  16, type       data, label demos/opposites_UV
 unique typenames:  16
proceeding with alignment of   3 datasets, paradigm type opposites, stimuli must be present in 1
alignments attempted with  3 datasets
 set   1: stimuli:  16, type       data, label demos/opposites_FG
 set   2: stimuli:  16, type       data, label demos/opposites_PQ
 set   3: stimuli:  16, type       data, label demos/opposites_UV
 unique typenames:  16
 typenames present in at least  1 datasets:  16
if_type_coords_remake=0 (determined from metadata)
knitting  16 stimuli across   3 datasets, dimensions   1  2  3
  allow reflection: 1, allow offset: 1, allow scale: 0, normalize scale: 0, rotate to pcs: 0
 calculations with allow_scale=0, if_normscale=0
 set  1: created shuffles for  16 stimuli
 set  2: created shuffles for  16 stimuli
 set  3: created shuffles for  16 stimuli
 creating Procrustes consensus from dim  1 to dim  1 based on component datasets, iterations:    2, final total rms dev per coordinate:  0.39150
 creating Procrustes consensus from dim  2 to dim  2 based on component datasets, iterations:    3, final total rms dev per coordinate:  0.42767
 creating Procrustes consensus from dim  3 to dim  3 based on component datasets, iterations:    3, final total rms dev per coordinate:  0.34850
knit by Procrustes and then pca
=aux_knit;
=;
[]=; %align stimuli via Procrustes and apply pca
=aux_knit_out_pca.components;
=idim;
=;
=;
=data_connect_ptrs; %just connect the points labeled hot and cold
; %standard plots, spaced along second dimension =idim;
=;
; %enhanced plots with rays and rings
end
end %plot_typeOutput:
 number of stimuli missing in dataset   1:    0
 number of stimuli missing in dataset   2:    0
 number of stimuli missing in dataset   3:    0
data table
    16    16    16
    16    16    16
    16    16    16

sa_pooled and data_align will be created.
NaN removal attempted with  3 datasets
 set   1: stimuli:  16, type       data, label demos/opposites_FG
 set   2: stimuli:  16, type       data, label demos/opposites_PQ
 set   3: stimuli:  16, type       data, label demos/opposites_UV
 unique typenames:  16
proceeding with alignment of   3 datasets, paradigm type opposites, stimuli must be present in 1
alignments attempted with  3 datasets
 set   1: stimuli:  16, type       data, label demos/opposites_FG
 set   2: stimuli:  16, type       data, label demos/opposites_PQ
 set   3: stimuli:  16, type       data, label demos/opposites_UV
 unique typenames:  16
 typenames present in at least  1 datasets:  16
if_type_coords_remake=0 (determined from metadata)
knitting  16 stimuli across   3 datasets, dimensions   1  2  3
  allow reflection: 1, allow offset: 1, allow scale: 0, normalize scale: 0, rotate to pcs: 1
 calculations with allow_scale=0, if_normscale=0
 set  1: created shuffles for  16 stimuli
 set  2: created shuffles for  16 stimuli
 set  3: created shuffles for  16 stimuli
 creating Procrustes consensus from dim  1 to dim  1 based on component datasets, iterations:    2, final total rms dev per coordinate:  0.39150
 creating Procrustes consensus from dim  2 to dim  2 based on component datasets, iterations:    3, final total rms dev per coordinate:  0.42767
 creating Procrustes consensus from dim  3 to dim  3 based on component datasets, iterations:    3, final total rms dev per coordinate:  0.34850